
- What is Log Analytics?
- What is the Activity Log?
- Two methods for ingesting Activity Log Data into Log Analytics
- Option #1 – Old/Current Method Being Deprecated where you go into your Log Analytics Workspace and hook the Activity Log directly into the workspace
- Option #2 – New Method leveraging Activity Log Diagnostic Settings
Part 2
- Leverage Kusto Query Language (KQL) to build a custom shared dashboard for Virtual Machines that have been created
- Leverage the KQL Query we build within PowerShell to pull data into a variable which will then be exported to CSV
Build KQL Query to find Virtual Machine creations
Behind the scenes, I just created two Virtual Machines:
- LogAnalytics01 VM
- LogAnalytics02 VM
Go into the Log Analytics Workspace and click on Logs. This is where we can write our queries and run them to validate we get results.

We can start off by simply specifying what type of data we are after. Because we are interested in Activity Log Data, we would specify AzureActivity.

But let’s say we have multiple Log Analytics Workspaces. Our intention is to leverage our query in a shared dashboard. How will the shared dashboard know what Log Analytics Workspace to use? We can change this to use workspace(“LogAnalyticsWorkspaceName”).AzureActivity. Our workspace name is ShudLogAnalytics. Therefore, this would be workspace(“ShudLogAnalytics”).AzureActivity.
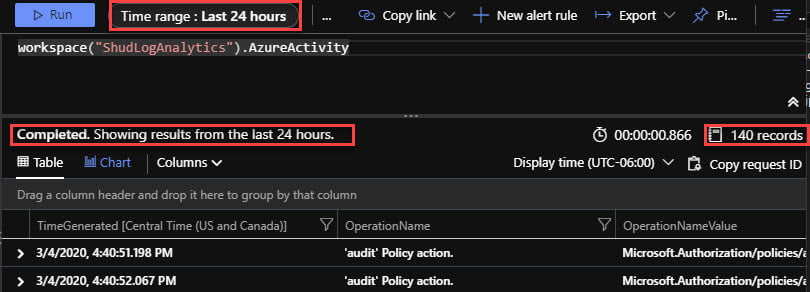
With this, we can see there are exactly 140 records.
Within this window, we can see the Time range is Last 24 hours. We can override this using that drop down, or put in the time range into our query. If we want the last 3 months of Activity Log Data, we can use: where TimeGenerated > ago(120d). However, if we want to specify a certain time period, we can use where TimeGenerated between(datetime(“2020-01-01 22:46:42”) .. datetime(“2020-02-29 00:57:27”)). More on using datetime in KQL is documented here. We will elect to get everything from the last 120 days.
Let’s re-run our query and we should see many more results..

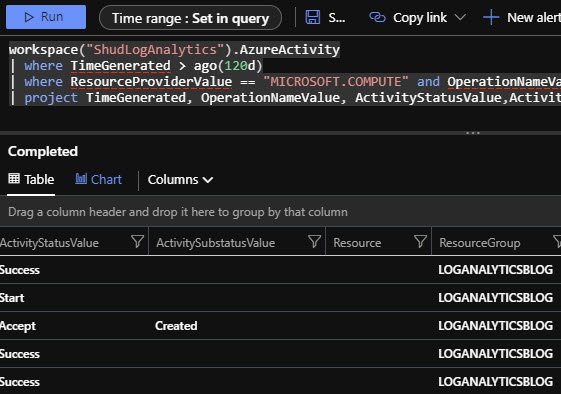
The Time range now displays that the Time range is Set in query. And we now have 6,525 records. But there’s a ton of Activity Log data. We simply want to see Virtual Machine Creations.
The following filter depends on which method of ingestion you are using. If you look back at the new method’s documentation provided here using Diagnostic Logs, there are some changes in differences of data. OperationName column is gone and it is replaced with OperationNameValue. Also, ResourceProvider is replaced with ResourceProviderValue
Therefore, if you are using the old/current method of data ingestion, you can use the following filter: where ResourceProvider == “Microsoft.Compute” and OperationName == “Create or Update Virtual Machine” .
However, if you are using the new method of data ingestion using the Activity Log’s Diagnostic settings, you would use the following filter: where ResourceProviderValue == “MICROSOFT.COMPUTE” and OperationNameValue == “MICROSOFT.COMPUTE/VIRTUALMACHINES/WRITE”.
Note: The values Microsoft.Compute and MICROSOFT.COMPUTE will display different results as they are case sensitive. You can use the =~ operator to make it not case sensitive.
Let’s re-run our query and we should see only Virtual Machine Creations and Updates. We’ll assume you are using the Activity Log Diagnostic Method of data ingestion. We’ll filter it down to only Creations soon.

Perfect, we are now seeing only data that has the following:
OperationNameValue of "MICROSOFT.COMPUTE/VIRTUALMACHINES/WRITEBut see the scrollbar at the bottom? It has a lot of horizontal scrolling area. There are a lot of columns. Many columns that you probably don’t care about. Let’s filter out columns we don’t care about. We can do that using project. Very similar to Format-Table in PowerShell. I have found I like to filter using the following:
project statement, project TimeGenerated, OperationNameValue, ActivityStatusValue,ActivitySubstatusValue,Resource,ResourceGroup,Caller,SubscriptionIdLet’s re-run our query and we should see only the columns we project.

The horizontal scroll bar is now much smaller. However, there is one big problem. Our column for Resource is empty.
If you used the old/current method of ingesting Activity Log Data into Log Analytics, the Resource column was there and correctly had the Resource column filled with data. The documentation here doesn’t mention the Resource column being gone. But it is… The ResourceGroup column still has data, just not the Resource column. I have a documentation bug submitted on GitHub here.
In order to fix this, we can modify our project a bit. Let’s change the following line:
Old line:
project TimeGenerated, OperationNameValue, ActivityStatusValue,ActivitySubstatusValue,Resource,ResourceGroup,Caller,SubscriptionId New line:
project TimeGenerated, OperationNameValue, ActivityStatusValue,ActivitySubstatusValue,Resource = Properties_d.resource,ResourceGroup,Caller,SubscriptionId Once you have modified that line, re-run the query.

We want to iterate more though. We only want to see Virtual Machines that have been created. See there in ActivitySubstatusValue there is a string called Created? Let’s filter on that and change our operators to not be case sensitive. Let’s modify the following:
Old line
where ResourceProviderValue == "MICROSOFT.COMPUTE" and OperationNameValue == "MICROSOFT.COMPUTE/VIRTUALMACHINES/WRITE" New line:
where ResourceProviderValue =~ "MICROSOFT.COMPUTE" and OperationNameValue =~ "MICROSOFT.COMPUTE/VIRTUALMACHINES/WRITE" and ActivitySubstatusValue =~ "Created"Once you have modified that line, re-run the query.

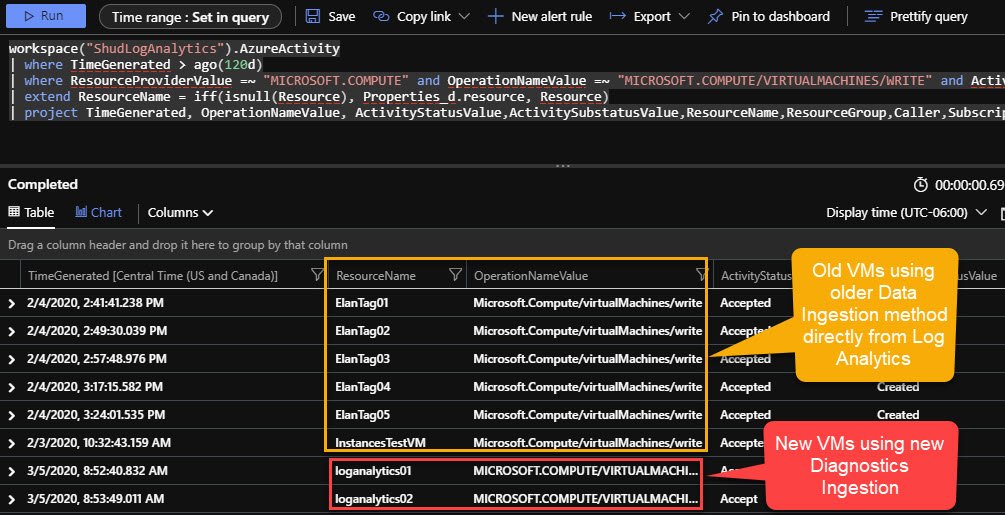
After re-running our query, because we changed == to =~, we now see other Created resources which were from our old Log Analytics data ingestion method of ActivityLog (Option #1 in Part 1). This will only be the case if you previously used the old/current method and switched over to the new method of using Activity Log Diagnostic Data. As mentioned, the old/current method had the Resource column populated and the new method of using diagnostic data does not. That is why we changed our project line to use Properties_d.resource to add the Resource Column. But now the Resource column for resources that were ingested using the old/current method (Option #1 in Part 1) of data ingestion no longer works.
In order to fix this, we have to use Kusto to create a new column name and do an iff() check and a isnull() check. Essentially, if Resource is null, then the resource was ingested using the new method (Option #1 in Part 1) and we should use Properties_d.resource. Otherwise, use the data in Resource column. Therefore, we’ll want to change our Kusto Query as follows:
workspace("ShudLogAnalytics").AzureActivity
| where TimeGenerated > ago(120d)
| where ResourceProviderValue =~ "MICROSOFT.COMPUTE" and OperationNameValue =~ "MICROSOFT.COMPUTE/VIRTUALMACHINES/WRITE" and ActivitySubstatusValue =~ "Created"
| extend ResourceName = iff(isnull(Resource), Properties_d.resource, Resource)
| project TimeGenerated, OperationNameValue, ActivityStatusValue,ActivitySubstatusValue,ResourceName,ResourceGroup,Caller,SubscriptionId
What were are doing is as follows:
- We added an extend to create a new column.
- If the Resource column is null (new method of data ingestion), then use the value from Properties_d.resource.
- If the Resource column is not null (old method), then use the value from Resource
- Removed Resource from project and replaced it with ResourceName
Now let’s re-run our query.
Voila! We now have our Resource Names using the ResourceName column for both methods of data ingestion all in one query. And we’re only filtering on VMs that have been created.
Build a Custom Shared Dashboard using our KQL Query
Now that we have our query built, which is below, let’s get on to creating a new Shared Dashboard:
workspace("ShudLogAnalytics").AzureActivity
| where TimeGenerated > ago(120d)
| where ResourceProviderValue =~ "MICROSOFT.COMPUTE" and OperationNameValue =~ "MICROSOFT.COMPUTE/VIRTUALMACHINES/WRITE" and ActivitySubstatusValue =~ "Created"
| extend ResourceName = iff(isnull(Resource), Properties_d.resource, Resource)
| project TimeGenerated, OperationNameValue, ActivityStatusValue,ActivitySubstatusValue,ResourceName,ResourceGroup,Caller,SubscriptionId
Go to the Azure Portal, click on Dashboard, then click on New dashboard.

Give your dashboard a name and click Done customizing.

Click the Share button. Kusto Queries can only be added to a Shared Dashboard.
Specify what Subscription and Resource Group to publish the Shared Dashboard to. Then click Publish.

Go back to the Log Analytics Workspace and then to Logs and re-run the query.

This time, click Pin to Dashboard.

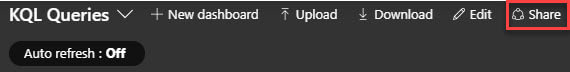
Choose the KQL Queries dashboard and click Apply.
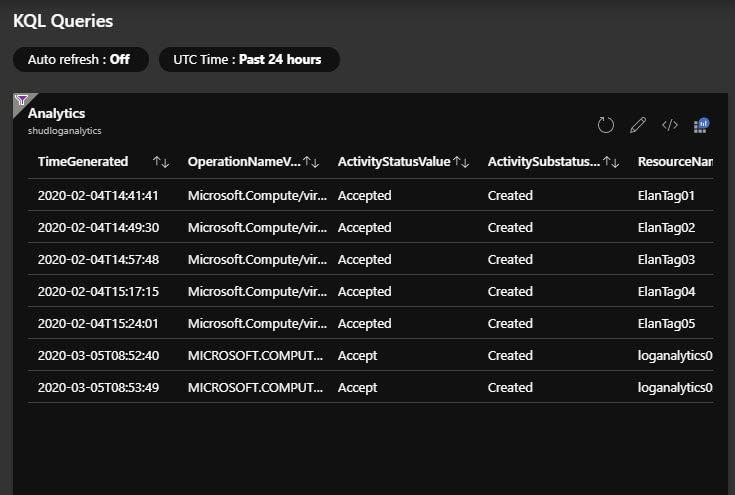
We can now see there is our Dashboard Item showing our Created VMs.

Unfortunately, the dashboard item doesn’t follow the time range specified in our Kusto Query. Therefore, click the icon I highlighted above.
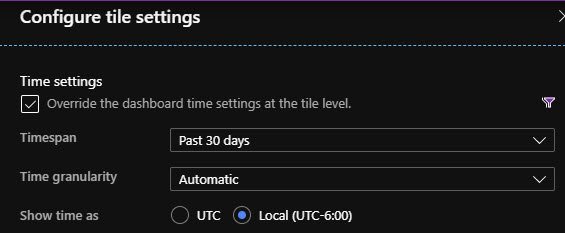
You can configure the time settings accordingly. There are many timespans to choose from including a custom timespan.
Alternatively, you can choose UTC Time: Past 24 hours and change that to whatever timespan you like. Doing it on the dashboard item itself as I displayed will change the timespan for only that tile. Changing the timespan at the dashboard level will apply that timespan to all tiles on that dashboard.
Don’t forget to publish your dashboard changes when done.
In Part 3, we’ll take a look at using our KQL Query to pull Log Analytics data via PowerShell and export the data to CSV.

Leave a Reply